How to Have a Good Command of the Concept of Histogram?
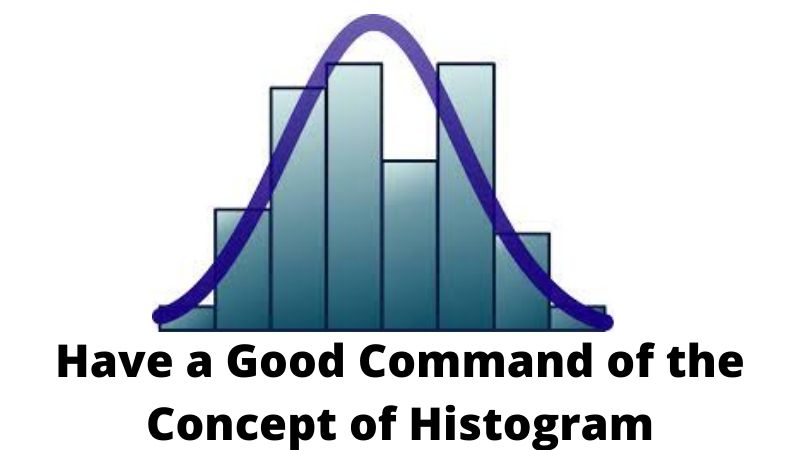
Whenever mathematics students are interested to have a good hold over the concept of statistics then they need to be clear about different kinds of concepts associated with it. Some of the very basic concepts include the bar graph, Histogram, frequency distribution and several other kinds of related things. The histogram is one of the best possible ways of ensuring that people will be very much capable of indulging in the graphical representation of the grouped frequency distribution that will further be based upon continuous classes. This is known as the area-based diagram that can be defined as the set of rectangles along with bases as well as intervals between class boundaries and the area is proportional to different frequencies into the corresponding classes. Into all these kinds of representations, every rectangle and adjacent base cover will be the same and the height of the rectangle will always be proportional to the corresponding frequency of that particular category.
What is the process to make the Histogram?
The steps of formulating the Histogram have been perfectly explained as follows:
- First of all, people very easily need to begin by marking the class intervals on the X-axis and the frequencies on the Y-axis
- After this people need to decide the scale of both the axis and it should be the same
- People need to be clear about the class intervals in terms of exclusiveness in the whole process
- After these people need to be clear about the drawing of rectangles with different kinds of basis as class intervals so that corresponding frequencies can be dealt with in the whole process as heights.
- The rectangle will be built on every class interval since the class limit will be marked on the horizontal axis and the frequencies will be indicated on the vertical axis
- The height of every rectangle will be proportional to the corresponding class frequency if the intervals are equal in the whole process
- The area of every individual rectangle will be proportional to the corresponding class frequency if the intervals are unequal
No doubt people are very easily stating that Histogram and bar graph are the same but there will be slight differences between both of them because the Histogram will never include any kind of gap between successive two bars.
What are the cases in which Histogram can be perfectly used?
Following are the conditions in which it can be perfectly used:
- Data should be numerical or in grouped frequency so that it can be well studied.
- Histogram can be used to check the shape of the data distribution
- It can be perfectly used in terms of checking whether the progress changes from one period to another or not
- It can be used in terms of determining whether the output is different whenever it will be including two or more processes
- It can be used in terms of analysing whether the given process will be meeting the customer requirements or not
Following are the basic points of differences between the Histogram and bar graph:
- The histogram is a two-dimensional figure and bar graph will be a one-dimensional figure
- The frequency will be shown on the area of every rectangle in the cases of Histogram and in the case of a bar graph the height will be showing the frequency and the width will not be having any kind of significance.
- In the cases of Histogram, it will be showing that rectangles will be touching each other and on the other hand in the case of bar graph it will be consisting of rectangles that will be separated from each other with the help of equal spaces
It is also very much important for the people to be clear about different types of Histogram available in the whole world of statistics so that children have a good command over the entire thing and are very much capable of presenting the data very well on the graph. Apart from this people also need to be clear about the representation of linear graph which is only possible whenever they will register themselves on platforms like Cuemath.


Post Comment
You must be logged in to post a comment.